CMDB Workspace provides a central place to work with the CMDB and access to various dashboards and tools to support tasks. It provides search functionality and a visual overview of the CMDB, health summaries, and recent activities related to CIs, Application Services, Discovery, and Service Mapping.
Use CMDB Workspace to view CIs that you manage and related tasks. CMDB Workspace is available as a ServiceNow Store app and is automatically installed with the San Diego release.
You need a minimum of one of the following roles to access some of the features available in the CMDB Workspace:
- sn_cmdb_admin
- sn_cmdb_editor
- sn_cmdb_user

It’s important to consider that there are some dashboards and list views in this workspace that require specific roles in addition to the “CMDB Admin”, “CMDB Editor”, or “CMDB User” roles.
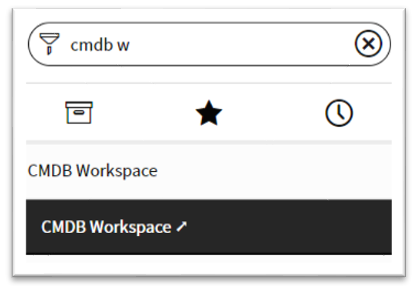
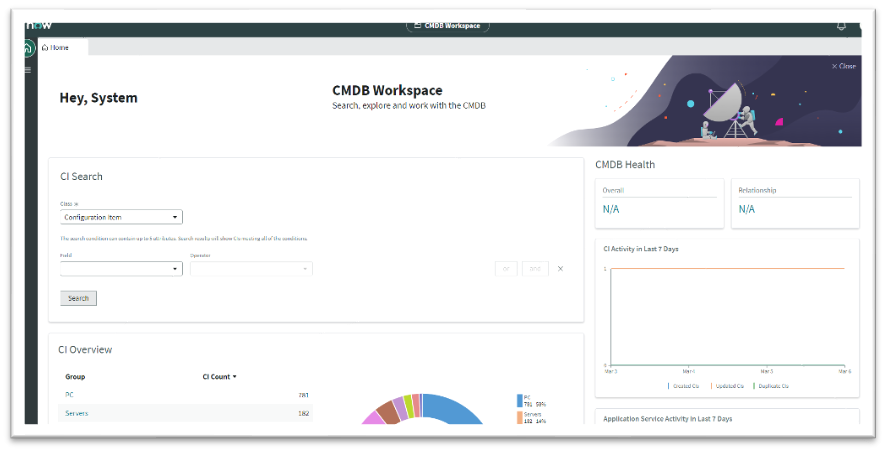
You can Access the CMDB Workspace from the application CMDB Workspace > CMDB Workspace to access the CMDB Workspace. The interface is like you can see in the following image.

The CDMB Workspace has the following parts:
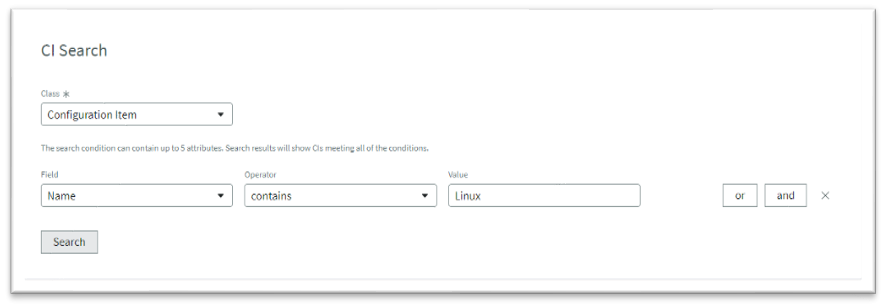
- CI Search: Specify conditions to search for Configuration Items (CIs) of a specific class or in all CMDB. You can include up to five conditions that are based on attributes specific to the selected class. In the results list, click a CI to see details about the CI including a timeline, health overview, and attributes for the CI.

- CMDB Health: Provides health metrics for CIs and relationships. Click the percentage numbers to navigate to the CMDB Health and CMDB Relationship Health dashboards:
- The Overall percentage number represents the health of all CIs as an aggregation of all three health Key Performance Indicators (KPIs). Those KPIs are correctness, compliance, and completeness, each consisting of submetrics.
- The Relationship percentage number represents the overall health of relationships as an aggregation of the orphan, duplicate, and stale relationships KPIs.
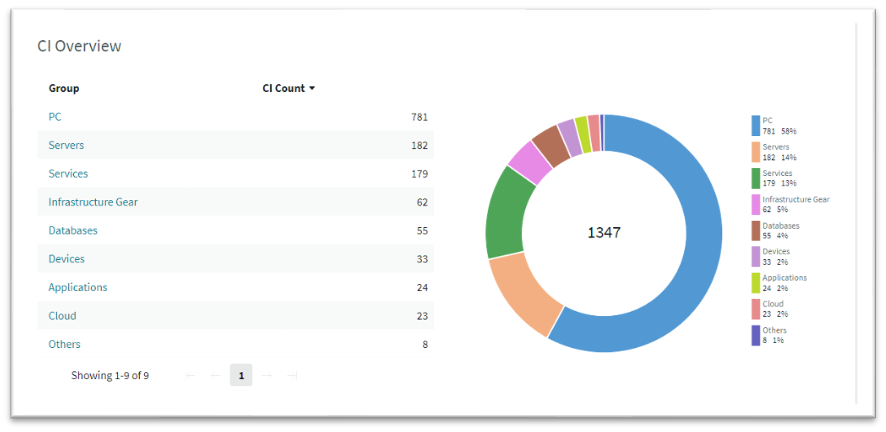
- CI Overview: Provides an overview of the CIs in the CMDB, grouped by common class categories such as Applications, Cloud, and Server.

Select a class group to see all the classes included in the group, and then select the class whose CIs you want to see. You can add custom class groups by creating CMDB groups with the following settings:
- Group type is set to ‘CMDB Workspace’.
- Populated by encoded queries.
Such custom class groups will appear in CI Overview after the next time that the “CMDB Workspace – Group and Encoded Query Counts” scheduled job runs and updates the CMDB Workspace.
- 7-Day Activity Trends: The CMDB Workspace includes the following charts, that provide an overview of various activities for the last seven days:
- Application Service Activity in 7 Days: Provides a chart showing metrics related to Application services such as the total number of Application Services, new and updated Application Services, and the number of Application Services with outages.
- CI Activity in Last 7 Days: Provides a chart showing metrics related to CIs such as the number of new CIs, updated CIs, and duplicate CIs.
- Discovery Activity in Last 7 Days: Provides a chart showing metrics related to Discovery such as the number of new devices and applications.
- Service Mapping Activity in Last 7 Days: Provides a chart showing metrics related to Service Mapping such as the number of new and updated Mapped Application Services.
- CIs Managed by Me: Provides a list of CIs that you manage, grouped by CI class. CIs appear in this list if you are a member of the group assigned to the CI’s Managed by Group attribute.
- My Work: Provides a list of CMDB Data Manager tasks assigned to you.
- Quick Links: Provides a list of links to CMDB dashboards and tools. These links are conditionally available based on the installation of applications, active plugins, and your assigned role. You can see the following links:
- CI Class Manager: Centrally view, create, or edit basic class definitions and class settings for Identification and Reconciliation (IRE) and CMDB Health.
- CMDB Data Foundations dashboard: Displays the CMDB Data Foundations dashboard.
- CMDB Data Manager: Centrally create, edit, review, publish, and track Data Manager policies and the tasks generated by the policies.
- CMDB Health dashboard: View CMDB health reports and configure the CMDB health KPIs and metrics that CIs are evaluated by in CMDB Health dashboards.
- CMDB Integration dashboard: View the CMDB Integration Dashboard for Service Graph connectors.
- Create Business Application: Add applications that your organization uses based on their functions and the business process they fulfill.
- Create Application Service: Create an application service, adhering to CSDM (Common Service Data Model), to standardize the maintenance and monitoring of services in your organization.
- CSDM Data Foundations dashboard: Displays the CSDM Data Foundations dashboard.
- Data Certification: Manages scheduled and on-demand validations of the CMDB data.
- De-Duplication tasks: Remediate a de-duplication task by using the Duplicate CI Remediator wizard which guides you through the duplicate CI reconciliation process.
- Dependency View: Provides a graphic infrastructure view for a CI and any application or business services that it is part of and that it supports.
- IntegrationHub ETL: Create and manage ETL transform maps, which integrate third-party data into the CMDB without compromising the integrity of the CMDB.
- Query Builder: Easily build complex infrastructure and service queries, that span multiple CMDB classes, non-CMDB tables, and that can involve many CIs that are connected by different relationships.
Don’t hesitate to contact us to receive the most actual information regarding ServiceNow and its products. Feel free to reach out in case you are interested in a demo or professional services.
